Why “works on my demo” isn’t a vision test
A vision model that “works on my demo” usually means it handled a small, curated set of images under controlled conditions. That’s not a test; it’s a proof that the code runs. In real use, images arrive with messy variation: glare, motion blur, unusual angles, partial occlusion, compression artifacts, and background clutter. The demo rarely includes the hardest cases or the cases that matter most to the business.
Demos also hide selection bias. People unconsciously pick examples that confirm the model’s strengths and skip the awkward failures. If the only success criterion is “looks right in a few screenshots,” you can ship a model that quietly fails on specific devices, locations, or user groups. A real evaluation forces you to define what “good” means, measure it on representative data, and look directly at the mistakes you’d otherwise avoid because they take time and money to collect.
Start with the deployment context and failure costs
A practical evaluation starts with where the model will live and what happens when it’s wrong. A defect detector on an assembly line faces consistent lighting and fixed camera geometry, but a retail shelf scanner deals with reflections, hands in the frame, and constant layout changes. A driver-assist feature might need predictable behavior at 30 fps, while a back-office document classifier can tolerate seconds of latency. These details determine what “success” even means: acceptable error rates, minimum confidence thresholds, and how often you can fall back to a human or a simpler rule.
Put dollar values (or time, safety, and trust costs) on the main failure types. A false negative that misses a cracked weld might trigger a recall, while a false positive might just slow throughput with extra inspections. In a user-facing app, frequent “can’t read this” errors can look like unreliability even if accuracy on clean images is high. This framing also surfaces constraints you can’t test away: limited labeling budget, privacy limits on storing images, device compute caps, and the operational burden of handling edge cases.
Build dataset splits that match how images really arrive
You can’t trust a random train/validation/test split if your images arrive in clusters. In production, “new” data often means a new store, a new camera model, a new shift, or a new season—not another sample from the same pile. If you let near-duplicates leak across splits (same item photographed minutes apart, same video burst, same document template), you’ll get a flattering test score that disappears the moment conditions change.
Split by the unit of variation that actually changes in the field: by site, by device, by user, by day/week, or by SKU batch. If the model will be used on future data, keep a time-based holdout to simulate that. Then add slice-level test sets for known “hard modes” (low light, glare, occlusion) and report metrics per slice, not just overall. The stricter splits lower scores and may require more labeling to stay statistically stable, but they produce numbers you can defend when the first rollout hits unfamiliar conditions.
Pick metrics that reflect user pain, not just leaderboard scores
Accuracy on a benchmark is rarely the thing users feel. They feel the specific mistake that blocks the workflow: the barcode that won’t scan, the “ID unreadable” loop, the defect that slips through and becomes a warranty claim. Start by listing the model’s top failure modes and map each to a metric: for detection, missed defects (false negatives) and nuisance alerts (false positives); for OCR or keypoint systems, “task success rate” (did the downstream field get filled correctly) and “manual review rate” (how often a human had to intervene).
Then pick thresholds and operating points the product can live with. A PR curve or ROC curve is useful, but you still need a chosen point that reflects real costs. If false positives trigger expensive rechecks, optimize precision at a minimum recall; if misses are catastrophic, lock recall and measure the precision you can afford. Report per-slice metrics and confidence calibration (how often a 0.9 score is actually right), because overconfident wrong answers create worse user experiences than uncertain ones. The measuring rare, high-cost errors needs enough labeled examples, which usually means targeted data collection and ongoing evaluation, not a one-time test.
Stress-test robustness: lighting, blur, occlusion, and domain shift
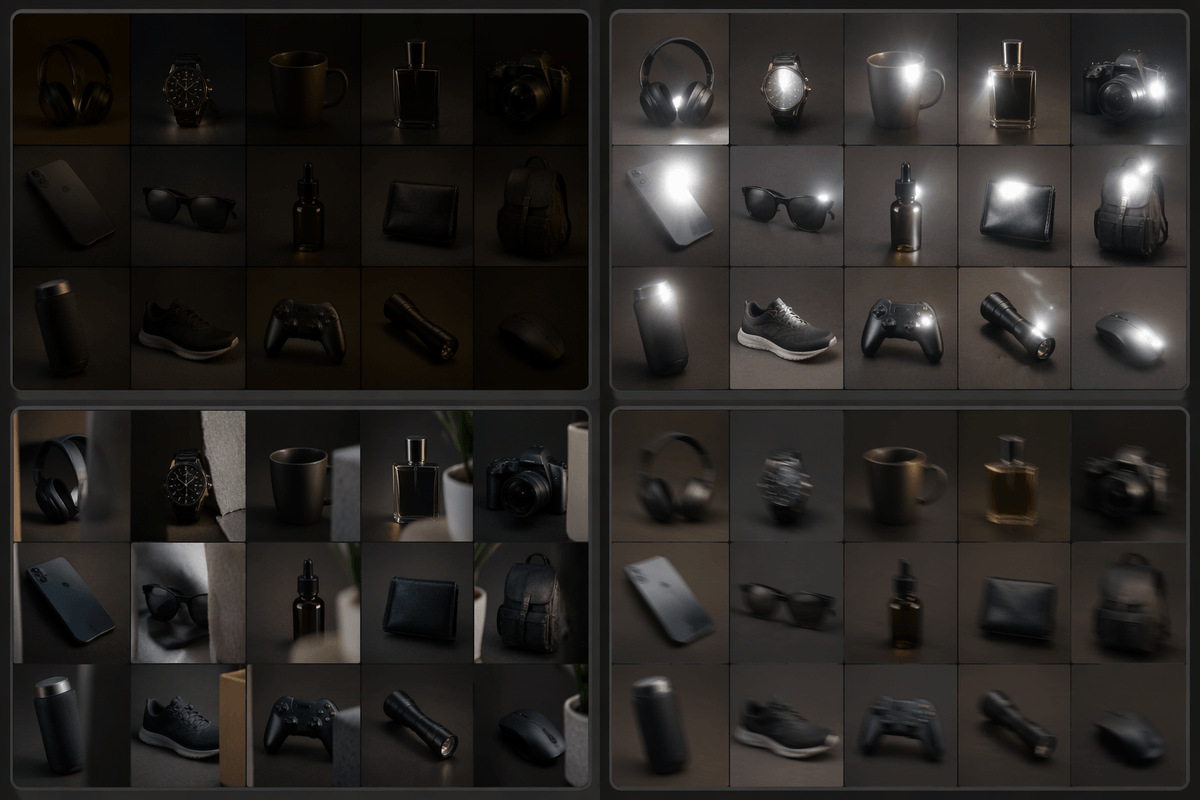
You can often predict a vision model’s first production failures by replaying ordinary “messy camera” conditions on purpose. Take a clean test set and create controlled variants: darken and brighten, add glare, introduce motion blur, downsample then re-compress, and mask parts of the object to simulate hands, packaging, or cropping. Run the same metric suite per corruption level, and watch for sharp drop-offs. Those cliffs are more actionable than a small average decline because they tell you where to change capture guidance, add training data, or insert a fallback.
Domain shift is the harder version: new stores, new phones, new backgrounds, new languages, new materials. Treat each as a separate slice and demand minimum performance per slice, not just overall. If you can’t get enough labeled examples for every slice, start with a small “canary set” for each new domain and measure drift indicators (confidence, error types, and input statistics). The practical cost is real: robustness testing consumes labeling budget quickly, and synthetic corruptions won’t fully replace collecting images from the actual new environment.
Test the whole pipeline: preprocessing, latency, and failure handling
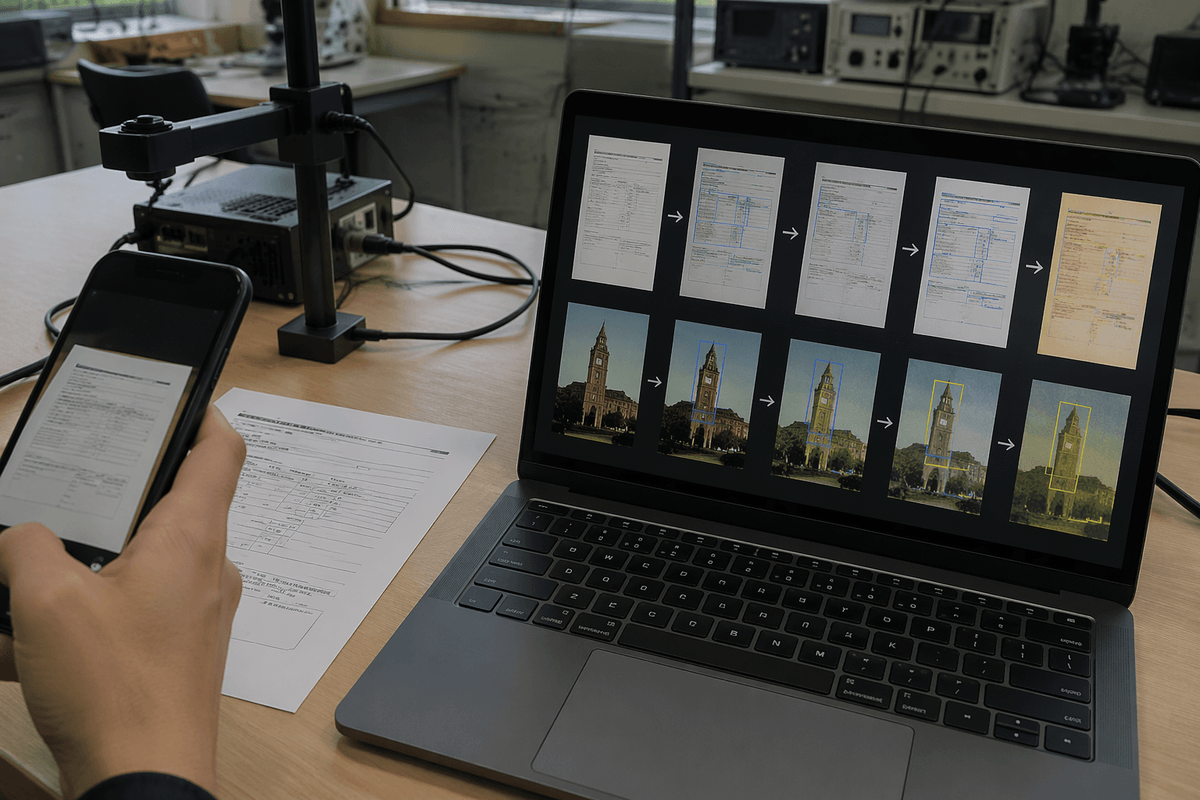
A model that scores well offline can still fail after it’s wrapped in resizing, cropping, compression, and device-specific color handling. Test with the exact preprocessing code and parameters that will run in production, including camera capture settings, rotation rules, and any “auto-enhance” steps on mobile. Small mismatches—like training on uncropped images but deploying on tight crops—often show up as systematic misses on certain layouts or devices. Also measure end-to-end task success, not just model accuracy: did the right box get drawn, the right field get filled, the right alert get triggered?
Latency deserves the same realism. Measure p50/p95 end-to-end time from image arrival to user-visible result under expected load, on the actual target hardware. The fastest model on a GPU server may be slower on a CPU-only edge device once you include decoding and postprocessing. Finally, force failure paths: empty frames, corrupted files, low confidence, and “no detection.” Decide what happens—retry, ask for a new photo, fall back to a simpler heuristic, or route to human review—and track how often those paths activate and how costly they are.
Turn findings into a go/no-go decision and a test plan
You now have numbers that can support a decision, but only if you turn them into explicit gates. Define a short go/no-go checklist: minimum performance per critical slice, maximum rates for the expensive failure modes, calibration and latency bounds on target hardware, and an acceptable fallback/manual-review rate. If any gate fails, the result isn’t “almost”; it’s “not yet,” with a specific fix (data collection, threshold change, capture guidance, or pipeline correction) and a retest date.
Convert the evaluation into a living test plan: frozen test sets (plus a drift canary set), a standard report template, and release criteria for each model change. Include post-launch monitoring signals you can actually measure—confidence distributions, slice coverage, and sampled human audits—because real-world updates (new devices, new lighting, new layouts) will arrive faster than new labels.