When an AI prediction feels convincing—but might be wrong
You open a dashboard and see a clean number: “82% chance,” “high risk,” “project will slip by 3 weeks.” It feels objective because it’s specific, formatted neatly, and often paired with a confident visual. The problem is that polish can hide mismatch: the model may have been trained on different customers, a calmer market, older policies, or cleaner data than you have today.
These tools also tend to speak in averages. They can look excellent overall and still fail in the cases you care about most—new products, unusual transactions, first-time patients, edge geographies, sudden shocks. A single prediction can be “confident” because the system must return something, not because it truly knows. Treat that first impression as a prompt to ask what the number is grounded in, and what it misses.
Start with the decision, not the model’s accuracy metric

You rarely need a model that’s “accurate” in the abstract. You need help making a specific decision: approve the loan, flag the invoice, reorder inventory, route a ticket to a human, delay a launch. Start by writing down what you’ll do differently if the prediction is high versus low, and what a wrong call costs on each side.
That framing changes what you should ask for. A 92% accuracy headline can still be useless if the remaining 8% contains the expensive mistakes, or if the model mostly gets easy cases right. For many workflows, false positives waste time and damage trust; false negatives let real problems slip through. You can’t review everything, so you’re picking a threshold. Judge the model by whether it reduces total harm and workload at that threshold, not by a single score on a slide.
What kind of prediction is this: risk score, forecast, or label?
A lot of confusion starts with a simple category error: treating every output as the same kind of promise. A label is a bin (“fraud” vs. “not fraud”), often used to trigger a workflow. A risk score is a ranking tool; “82” usually means “higher than most,” not “82 out of 100 will happen.” A forecast is a numeric estimate with units and a time window (“sales next week,” “ETA in hours”), and it should come with an expected range, not just a point.
Ask what the model is optimizing for and what the number is allowed to mean. Risk scores are useful for prioritization but can be dangerous when read as literal probability. Labels feel decisive but hide borderline cases where humans would disagree. Forecasts invite over-precision, especially when the future can shift faster than the data refresh cycle.
Before you act, restate the output in plain language: “This is a rank,” “This is a probability under specific conditions,” or “This is a time-based estimate.” If you can’t translate it cleanly, you don’t yet know what you’re being asked to trust.
Evidence you can demand: performance on data like yours

You can’t validate a black box by staring at it, but you can demand evidence that it works on data that resembles your reality. A vendor’s benchmark on “industry data” or a leaderboard score is weak if your customers, policies, channels, or time period differ. Ask for results on a holdout set drawn from your environment, or at least a clearly described slice that matches your case mix: new vs. returning users, specific regions, high-value accounts, recent months, and the messy records you actually ingest.
Push for breakdowns, not just one average: performance by segment, by volume level, and around the decision threshold you’ll use. If the tool prioritizes reviews, you want “precision at the top” and how many true issues you catch per 100 investigations. If it forecasts, ask for error over time windows that match your planning cycle. The privacy rules and data-sharing limits can block a clean test, so plan for a limited pilot, shadow mode, and a path to re-check performance as your data drifts.
When confidence is fake: calibration, uncertainty, and edge cases
You’ve probably seen a model output that reads like certainty: “0.91 probability” or “very high confidence.” If a tool says “90%” across many similar cases, roughly 9 out of 10 should actually occur. Many systems don’t behave that way. They’re good at ranking who is higher risk than whom, but the numeric confidence is inflated, especially after thresholds, post-processing, or when the input data is cleaner than what you have.
Ask to see a reliability curve (sometimes called a calibration plot) and how it changes by segment. A model can be calibrated overall and still be overconfident for a subgroup you handle often, like new accounts or low-volume regions. Also ask what the model does when it doesn’t know: does it give an uncertainty range, abstain, or route to review? Forcing a single answer is convenient for automation, but it’s costly at the edges—rare events, sudden policy shifts, missing fields, and first-time scenarios—where “high confidence” often means “no signal, but still a number.”
Guardrails that make predictions safe to use
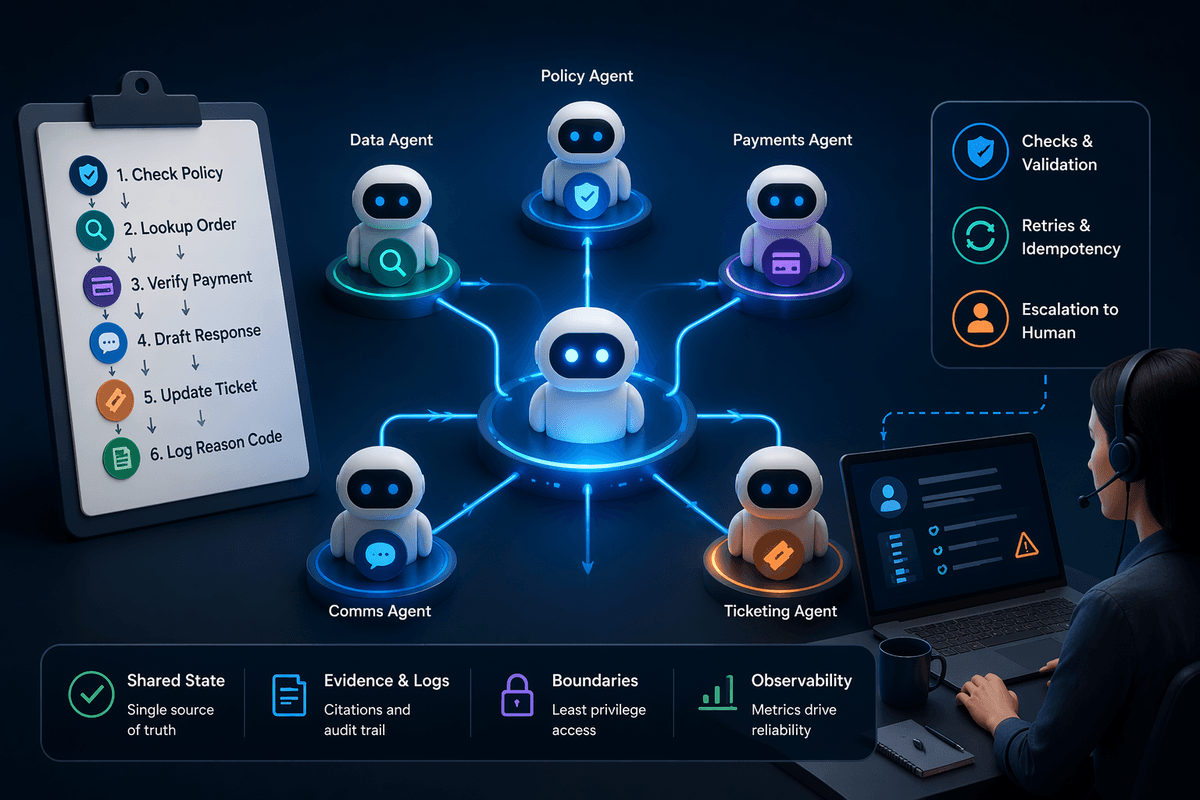
The most important design choice has already been made: treating a model prediction as an input to a decision rather than the decision itself. Guardrails formalize that principle. Every production system should include an abstention path for situations where essential fields are missing, incoming data falls outside the model's experience, or confidence drops below an acceptable level. Instead of forcing an uncertain prediction, the system should explicitly return "unable to determine" and hand the case to a reviewer or a simpler rule-based workflow. That approach increases operational workload, but it prevents subtle automation failures from accumulating unnoticed over time.
Decision thresholds should reflect the consequences of the action, not the desire to maximize automation. A moderate-risk prediction may only justify an additional verification step, whereas irreversible actions—such as denying service, suspending an account, or canceling an order—should require stronger evidence and confirmation from an independent signal. Explanatory outputs, including reason codes or the most influential features, are most valuable when they direct reviewers toward the small number of inputs that could change the outcome, rather than serving as proof that the prediction is correct.
Deployment is the beginning of model management, not the end of it. Performance drift, outcome trends across different user groups, and changes in upstream data all deserve continuous monitoring. Defining circuit breakers that pause or limit automated decisions when error rates rise or data quality changes helps contain failures before they spread. The most dependable systems treat model predictions like any other production dependency: observable, auditable, and designed to fail safely when conditions move beyond what they were built to handle.
A quick trust checklist before you act on AI output
You’re about to act on a prediction; run a fast check that matches the stakes. What decision will this change, and what’s the cost of being wrong in each direction? What is the output really—rank, label, or probability with a time window—and is it calibrated on cases like yours? Is today’s input data complete, current, and within the model’s expected range, or are key fields missing and segments shifting?
Then ask what happens when it’s uncertain: does it show a range, abstain, or still output a crisp number? Can you see recent performance by segment near your threshold, not just an overall score? If you can’t answer these in a minute, treat the output as a lead, not a decision.